
How do I start a new build?
Via the BUILD menu item.
This is on the top right hand side of any page on the site. Clicking it will bring up a fresh build page from which you can compile a list of components, starting with the CPU for the baseline build.
Via the "Add to PC Build" button.
This button can be found on various pages. Clicking this link will lead you to the build page with pre-populated components based on the current page. For example, clicking the "Add to Build" button near the top right hand side of the benchmark performance report will bring all the components from that benchmarked PC into the baseline build and the alternative build.
How do I select components for the build?

Work your way through the tabs: CPU, GPU, SSD, HDD, RAM and MBD, selecting components firstly for the baseline build (left hand side), then for the alternative build (right hand side) if required. Simply clicking on the component in the list adds the hardware to the builds.
Components are ordered based on popularity (hits) with priority given to components found in PCs with the same combination of already selected components. The number of hits, the average benchmark score, the value metric and price is listed. Clicking on the drop down menu brings up the search function allowing for a greater choice of components.
What does 100x mean?
100x hits means that there are 100 PC benchmarks in the database containing that component as part of the same combination of hardware that has already been selected. 1000 hits (without the x) means there are 1000 PC benchmarks which have that component in any combination. This allows you to see not only which components are popular, but which are popular for the combination of components already selected in the build. Conversely, it allows you to see what combination is unpopular and therefore may infer unsuitability due to performance bottlenecks or incompatibility.
How do I see real world benchmarks?
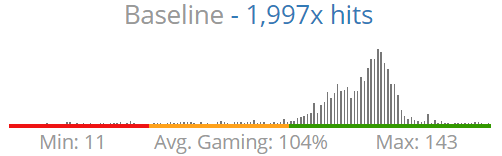
At any stage of building, the frequency distribution chart displays the gaming scores of the real world benchmarks with the selected components. This enables you to see how consistent the results are. You can delve deeper into the individual real world benchmarks by clicking on "Load baseline/alternative user benchmarks" towards the end of the page.
How do I use virtual benchmarks?
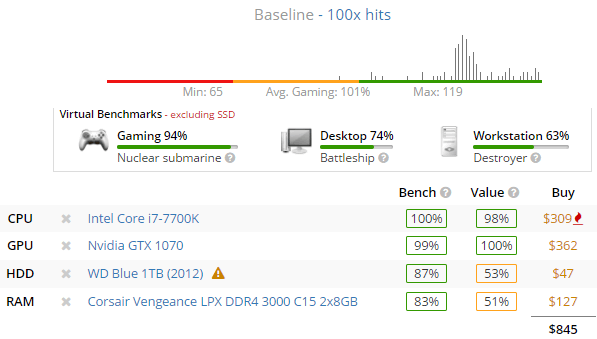
Adding a full list of components for each build allows you to see the virtual overall PC benchmark score for gaming, desktop and workstation. This score is based on average real world performance data collated by UserBenchmark. Learn more about the calculations and performance categories here. You can compare the baseline and alternative in terms of virtual benchmarks, price and value with a view to selecting the best hardware for your situation. You can also share your virtual builds with friends to seek their opinion.
How do I save a build?
Create a free UserBenchmark account and then save your builds by clicking the "Save build to profile" button: . Edit the build description to give the build a more memorable name. Come back to the saved build whenever you like - allowing you to take your time investigating the details of your anticipated hardware before spending a single penny.
2024 Hardware Rankings
PC Score |
PC Status |
|
|---|---|---|
| 0 secs agoB550M PRO-VDH WIFI (MS-7C95) | Nuclear submarine | 36% |
| 5 secs agoAsus TUF B450-PRO GAMING | Aircraft carrier | 41% |
| 26 secs agoLenovo 82MD | Tree trunk | 63% |
| 31 secs agoAsrock P67 Pro3 | Battleship | 26% |
| 55 secs agoHuawei BOHK-WAX9X | Tree trunk | 48% |
| 1 min agoAsus M4N68T-M LE | Jet ski | 33% |
| 1 min agoAsus PRIME X570-P | Nuclear submarine | 58% |
| 1 min agoGA-B550 AORUS ELITE AX V2 | UFO | 54% |
| 1 min agoAZW S5 | Aircraft carrier | 39% |
| 1 min agoToshiba TECRA A50-D | Destroyer | 66% |
| 2 mins agoB650 GAMING PLUS WIFI (MS-7E... | UFO | 51% |
| 2 mins agoB450M MORTAR MAX (MS-7B89) | Tree trunk | 78% |
| 2 mins agoAcer Nitro N50-600 | Aircraft carrier | 77% |
| 2 mins agoAsrock A320M/ac | Aircraft carrier | 65% |
| 3 mins agoAsrock B450M/ac | Aircraft carrier | 43% |
| 3 mins agoMSI PRO Z690-A WIFI DDR4 | UFO | 79% |
| 3 mins agoASUS TUF Gaming A17 FA706NF_... | Tree trunk | 47% |
| 3 mins agoLenovo 82UG | UFO | 64% |
| 3 mins agoASUS TUF Gaming F15 FX506LU_... | Destroyer | 16% |
| 3 mins agoAsus PRIME Z790-P | UFO | 71% |